
Every detection. A clearer picture.
Turn recorded detections into operational understanding, with the evidence still in view.
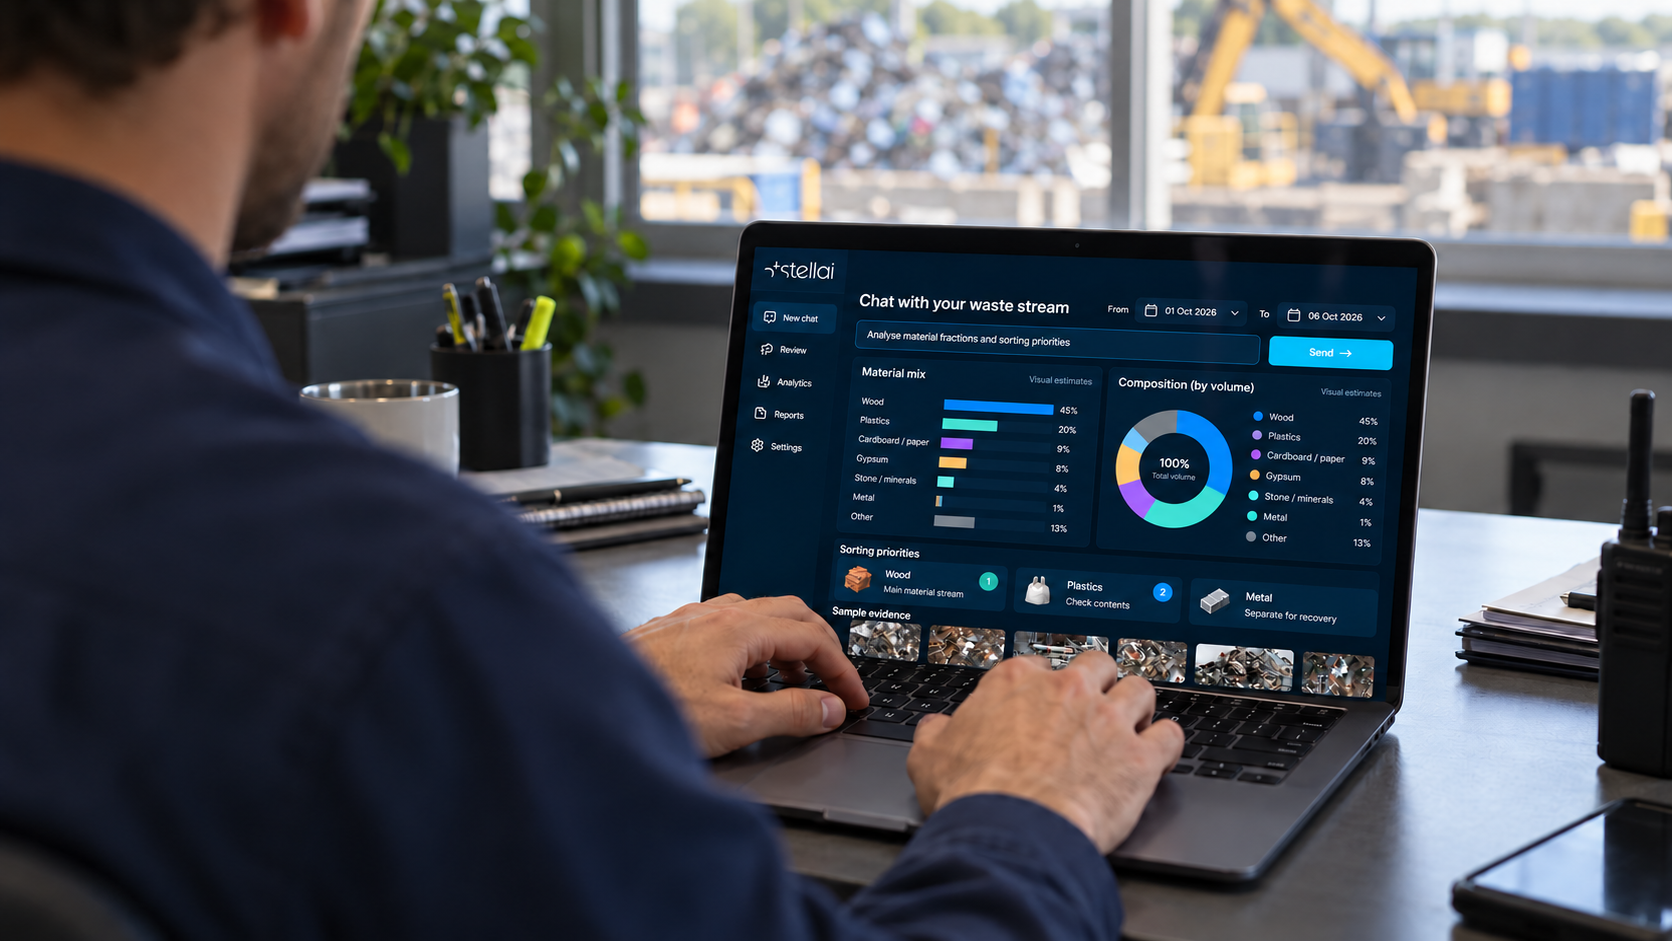
Interface shown for illustration. Values are not measured customer outcomes.
From single events to useful patterns.
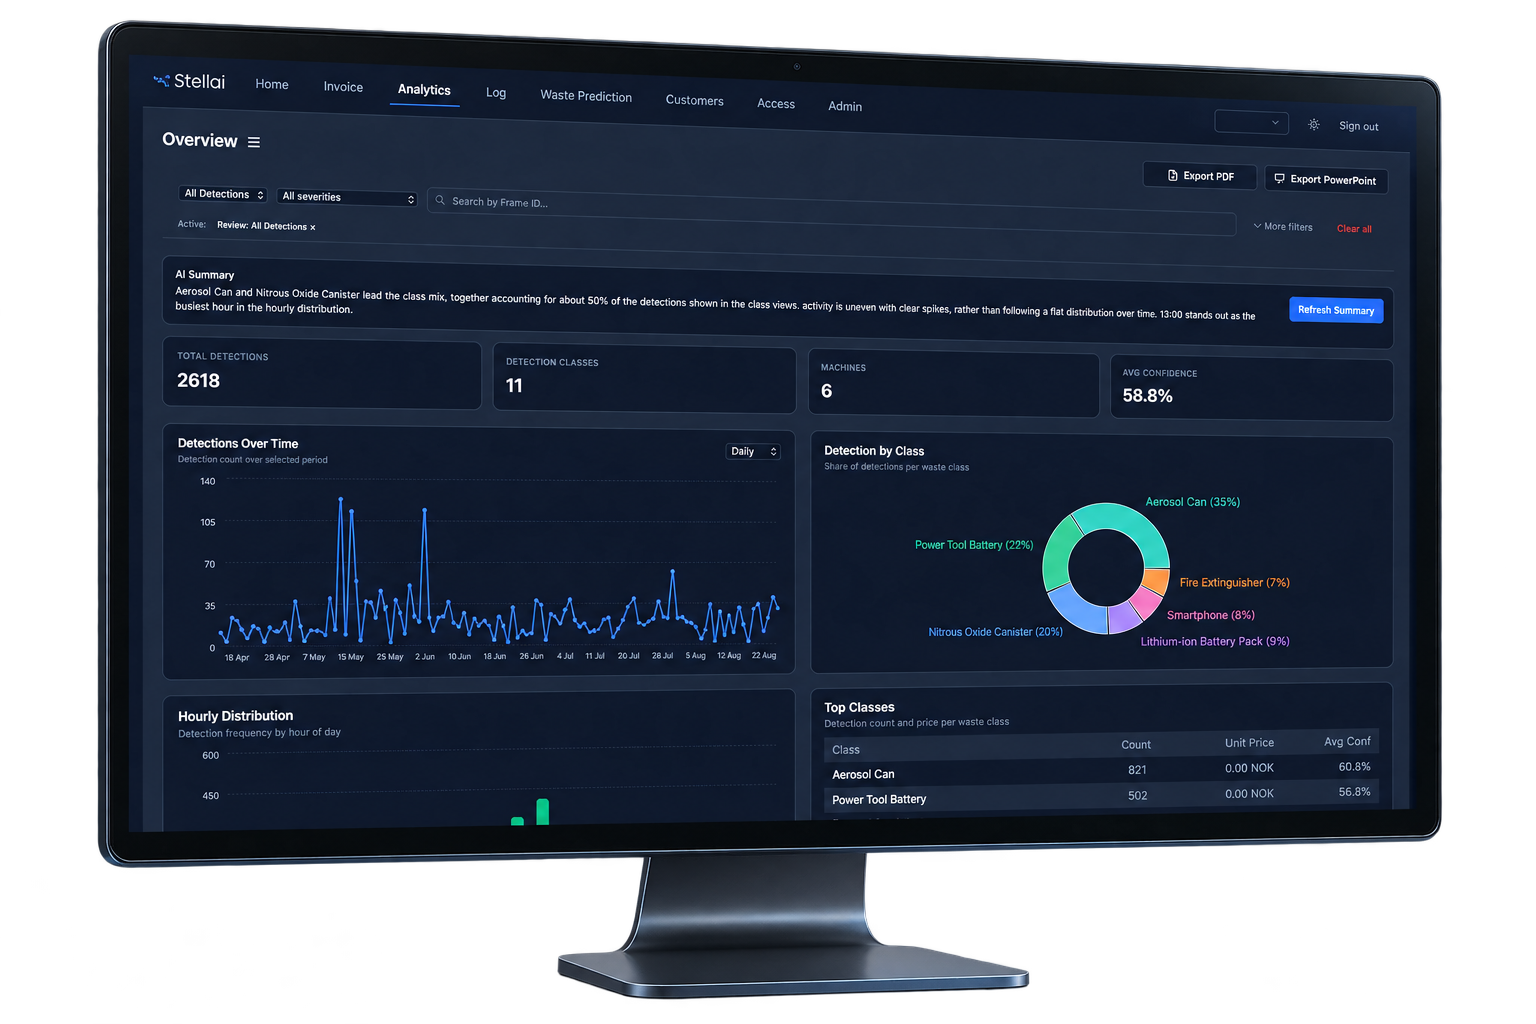
See detection counts and object types, frequency and trends. Compare periods and filter the events that matter.
Where it runs
Local alerts run on the machine. Cloud services support event history, analytics and sharing validated model updates.
See the patterns. Understand the events.
Explore recorded detections, analyse trends and ask questions to understand patterns and events across your operation.
Interface shown for illustration. Values are not measured customer outcomes.
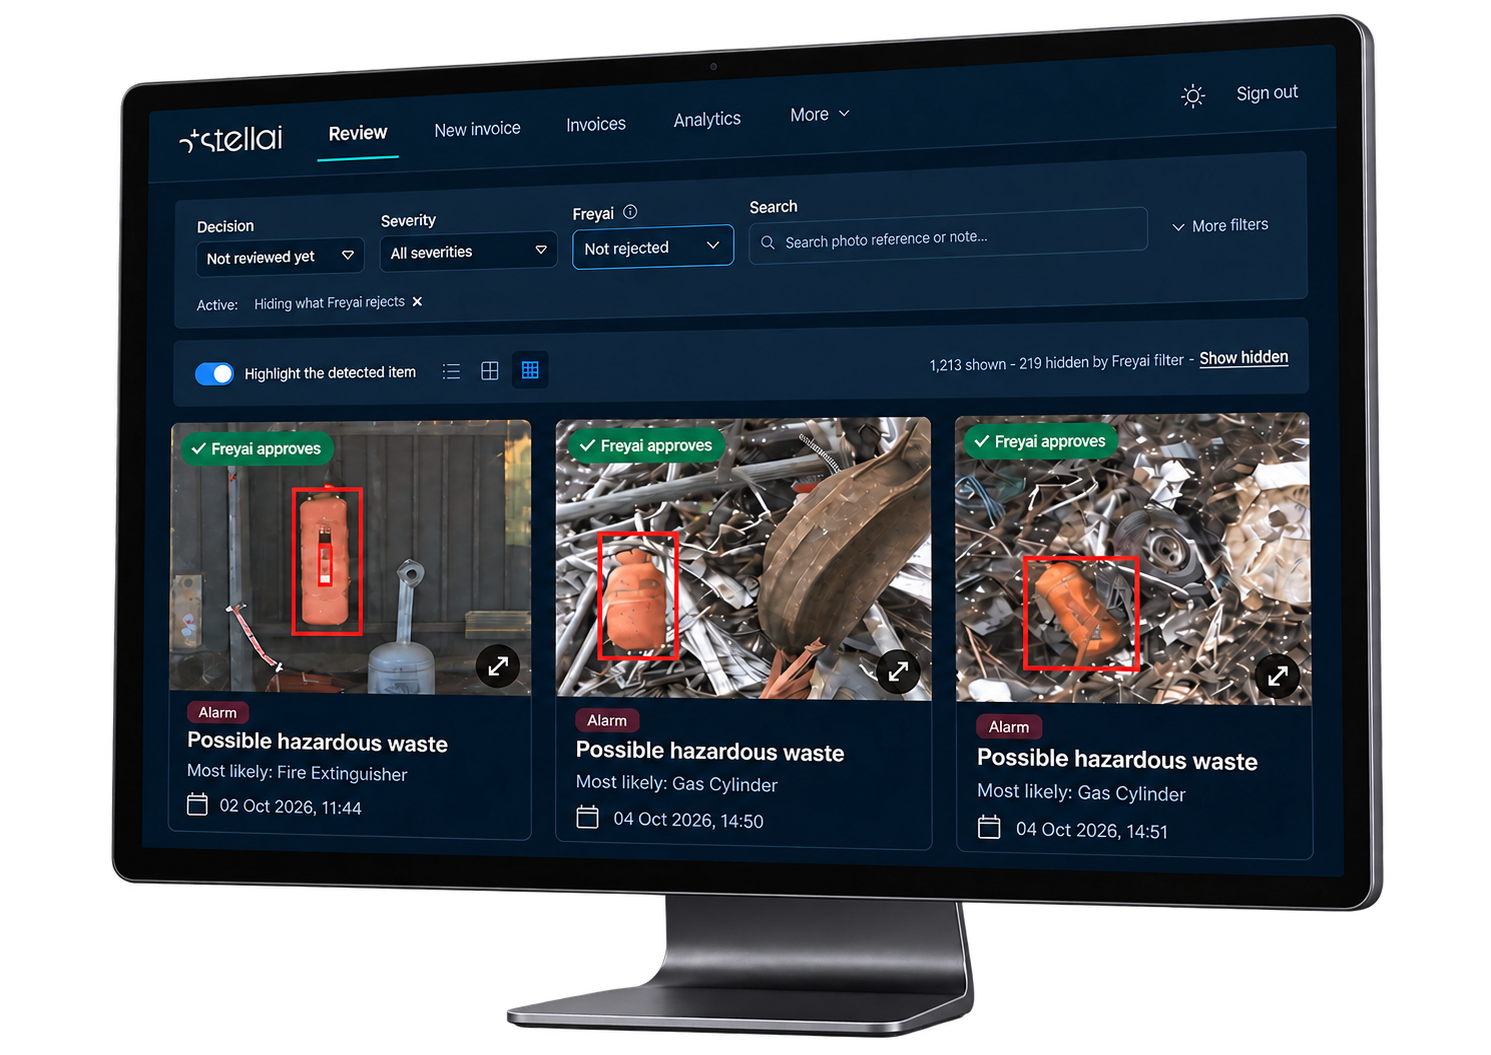
Follow up with context.
Cropped event images with date, time, site and machine ID. Records help teams follow up anomalies and trace material back to deliveries where supporting records exist.
Waste analyser.
Composition and picking analyses across all waste fractions, questions across your waste data and exportable operational reports.
Interface shown for illustration. Values are not measured customer outcomes.
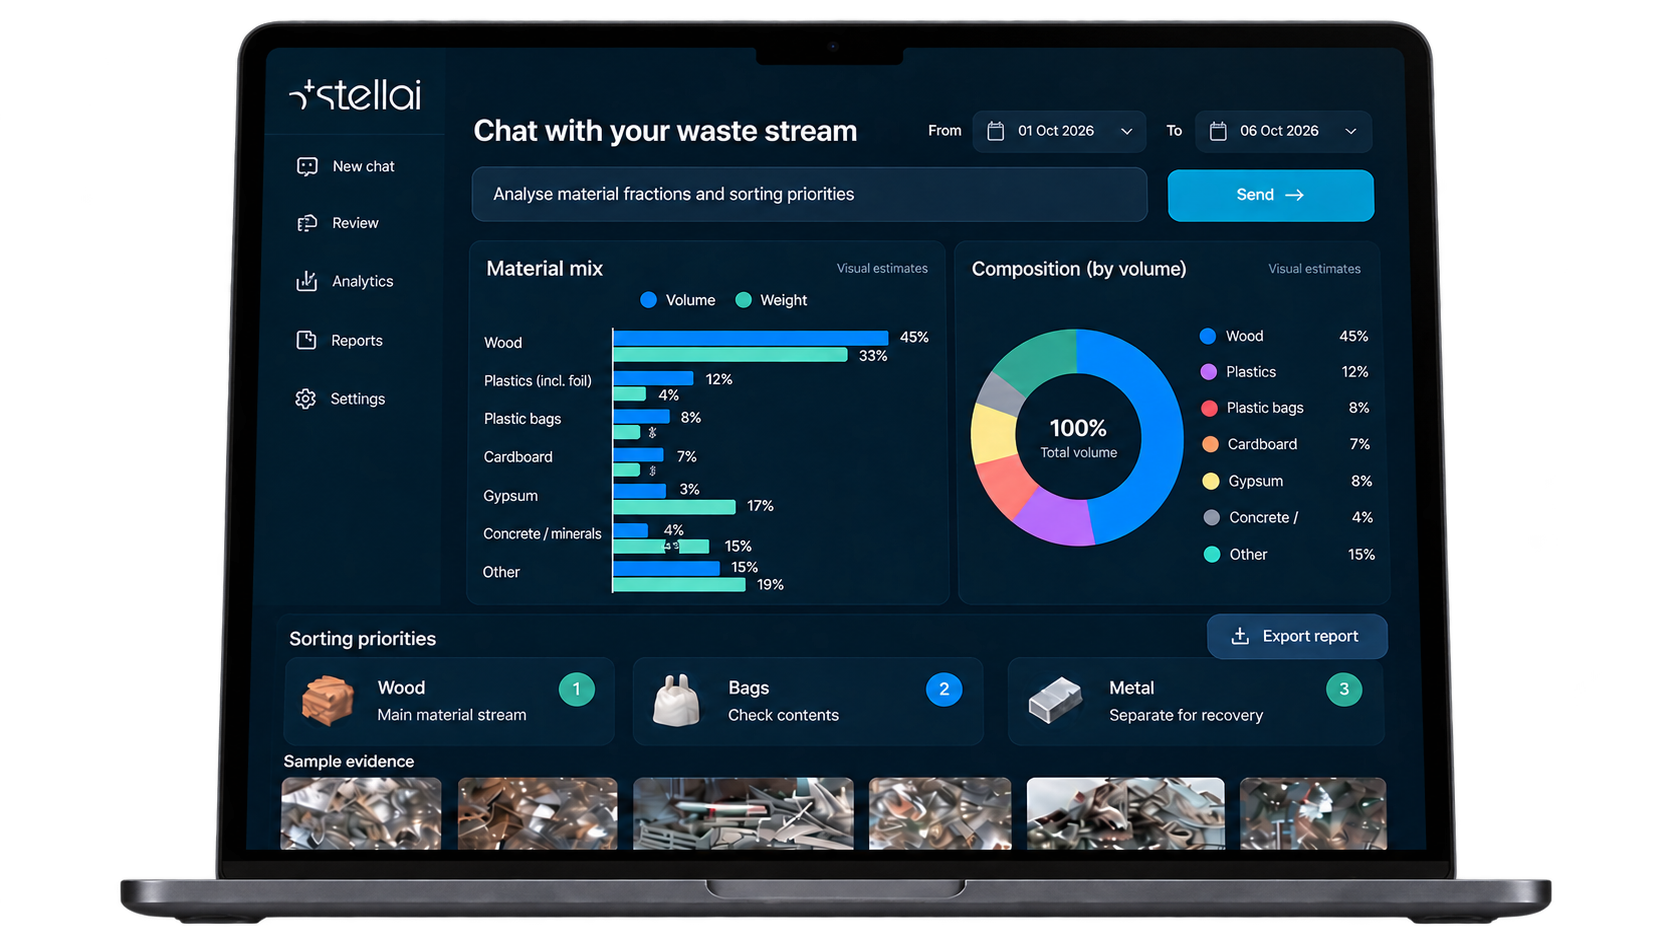
- Composition analysisWaste-fraction composition across all fractions.
- Picking analysisOperational picking patterns, as part of the waste analyser.
- Questions and reportsAsk across your waste data and export operational reports.